

TL;DR
The outcome:
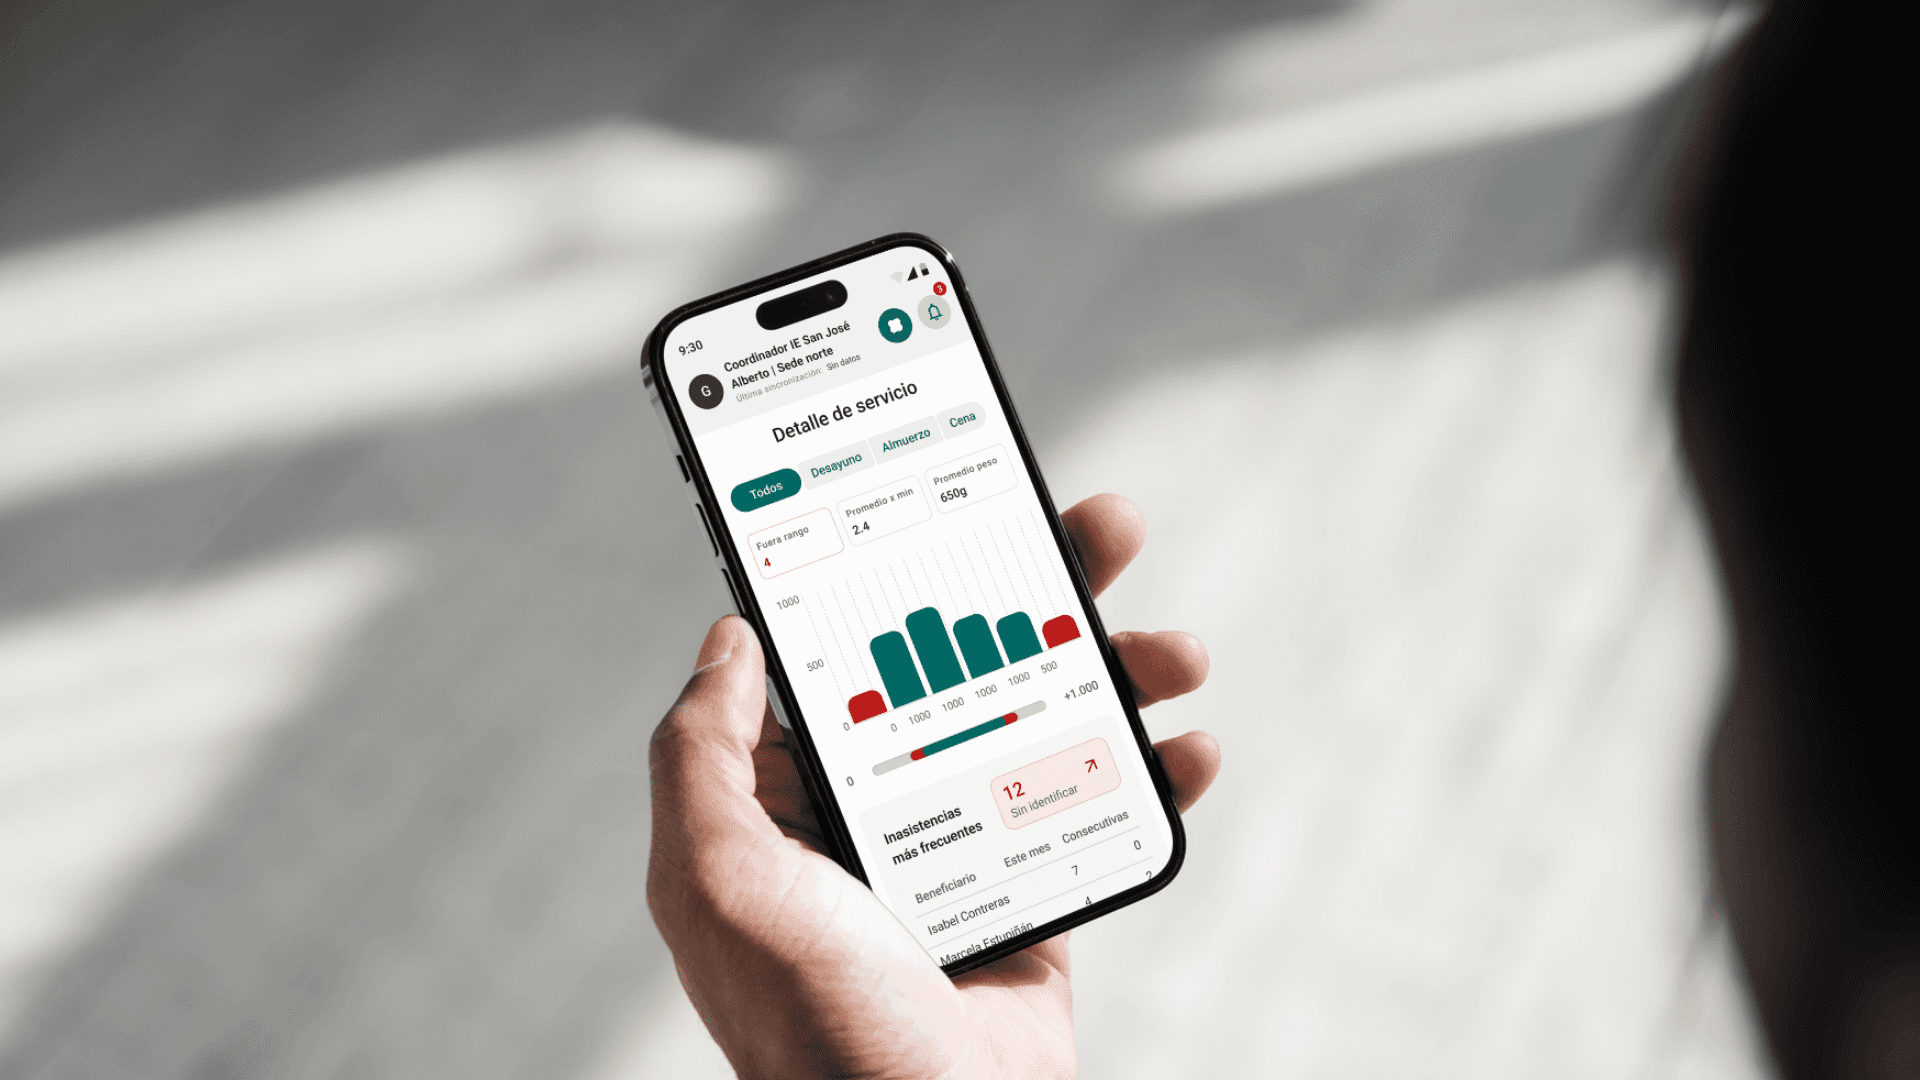
Redesigned the Coordinator dashboard to surface critical operational data: unverified deliveries, active services, enrollment progress; as actionable items rather than buried metrics
Designed contextual feedback modals at key coordinator workflows (triggered at enrollment, incident reporting, and dashboard views) creating a passive research layer inside a product that had no formal user testing process.
Surfaced 'Deliveries to verify', deliveries where the machine failed to identify a student, directly on the home screen with a direct link to the resolution flow, removing a multi-step search through filters
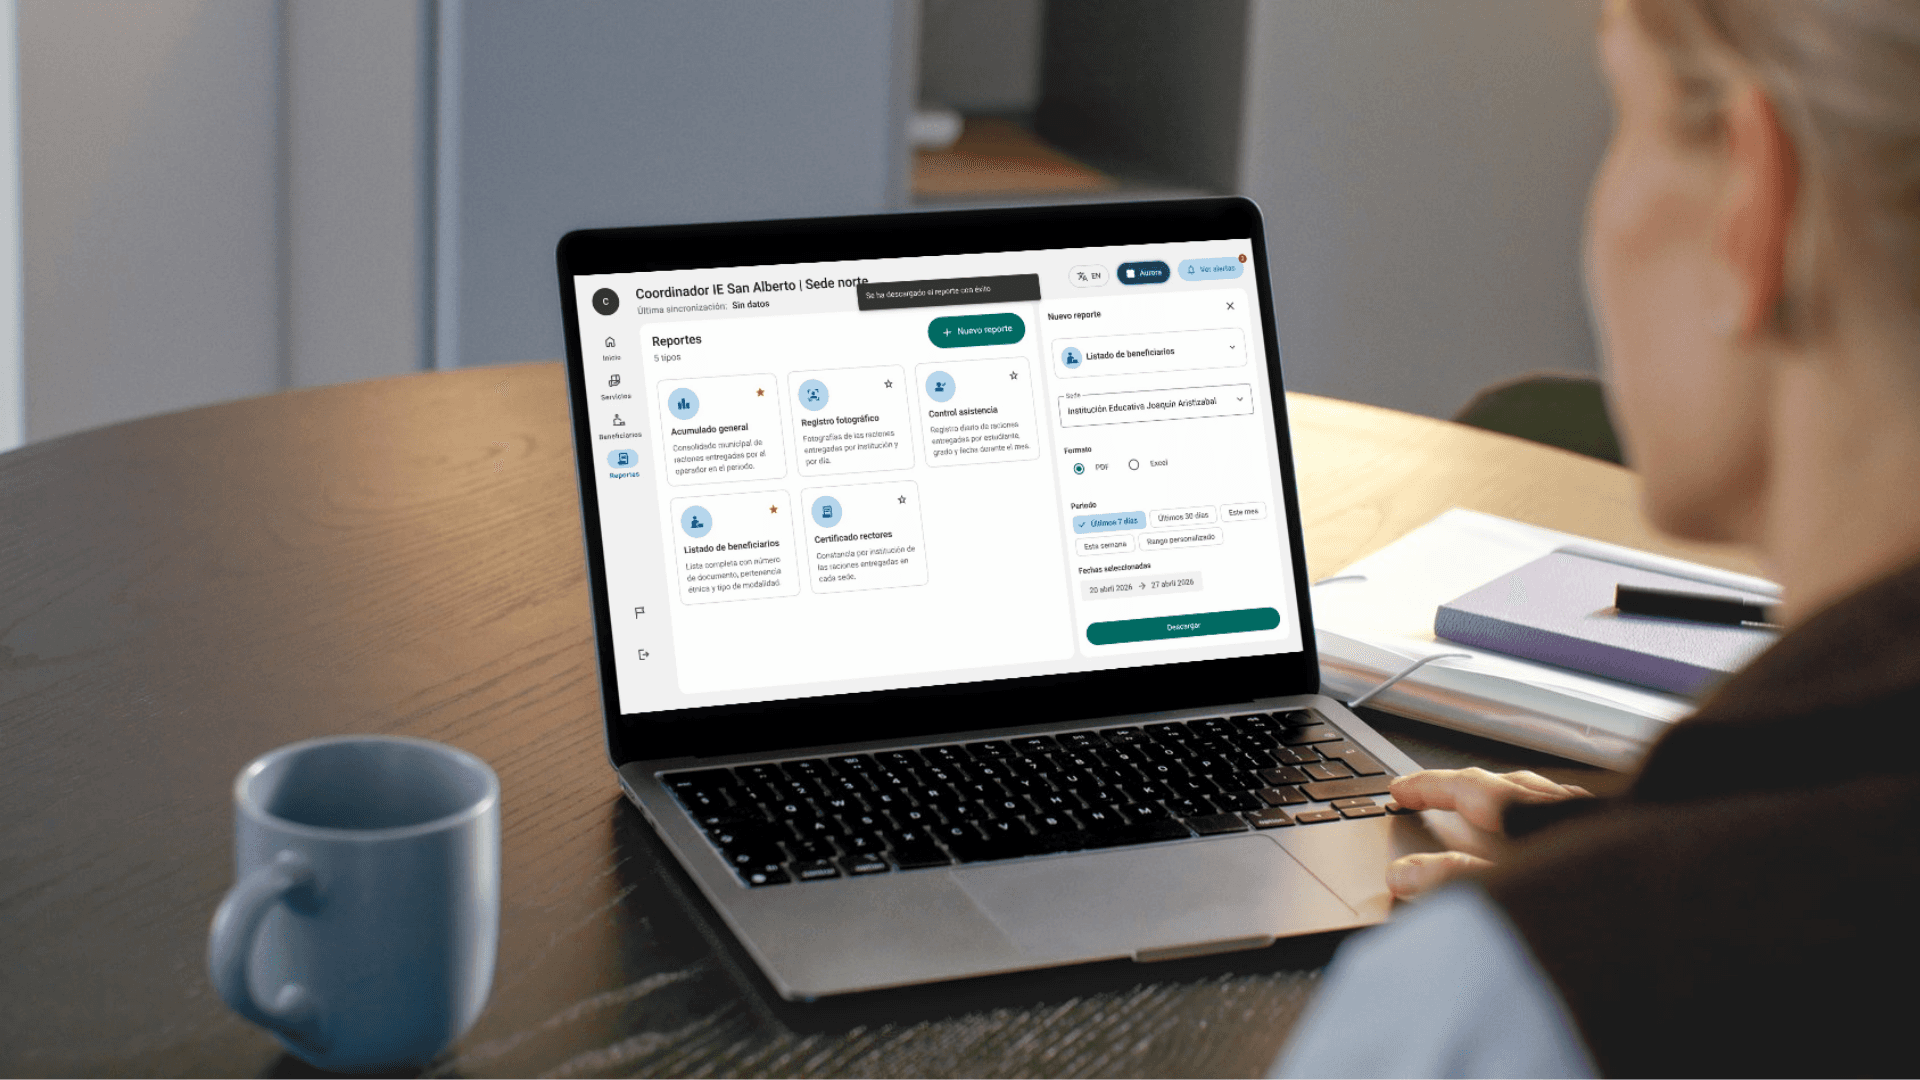
Designed the Reports module as a structured gallery with favoriting, history, and clear report descriptions, replacing a dropdown list with no context
What went wrong: The work was implemented but cut short. Commercial pressure to close the deal — not user needs — determined what was finished and what wasn't.
What I learned:
Designing visualizations for data that might not exist (or might be wrong) forced me to think about trust signals
When commercial timelines override product quality decisions, the designer has limited leverage, but can still document what was left unfinished
Main challenge
Context:
PAE is a Colombian government school meal program serving students from primary school through high school. The portal supports a chain of actors: site coordinators, rectors, municipal administrators, governors; each seeing a filtered view of the same data. A coordinator at a single school runs multiple meal services daily, enrolls students, flags incidents, and generates compliance reports. The product was being sold to government entities, and demos to decision-makers were the primary sales tool.
My hypothesis:
A coordinator's home screen should reduce daily friction, not showcase system features. If the three most urgent tasks — checking delivery progress, flagging unidentified students, and reporting incidents — required more than two clicks to reach, the interface was working against the user.
The constraints that shaped everything:
Hardware dependency: delivery data came from a physical weighing machine with active faults and fewer than 10 units deployed — meaning dashboard data was often incomplete or stale
Demo-first pressure: the Portal Gerencial (executive view) was the commercial priority; coordinator-facing design was secondary to what looked impressive in sales demos
No user research budget or timeline: design decisions were made from a field visit to one school and indirect feedback from the product team
Existing design already in development: I was working on top of a previous design system, not starting from scratch, some structural decisions were locked
Phase 1: Mapping what coordinators do Phase 2: Restructuring dashboard around tasks, not data Phase 3: Elevating incident reporting Phase 4: Redesigning reports module
Key decisions:
Embedded feedback collection at the points of highest friction rather than relying on post-use surveys. A lightweight research mechanism for a product with no formal user access or testing budget.
Moved incident reporting to the top bar — elevating a compliance-critical daily task from a floating button that competed visually with nothing to a persistent, visible primary action.
Designed the Reports module as a gallery with descriptions and favorites rather than a dropdown — because coordinators and rectors needed to understand what each report contained before generating it, not after.
Difficulties:
The hardest constraint wasn't technical, it was organizational. The product was being positioned as finished before coordinator-facing improvements were complete. Advocating for JTBD-driven design in a context where the sales cycle had already determined the timeline meant pushing for changes that were treated as scope creep rather than core product quality.
What went wrong?
Commercial pressure ended the process. The exact words: 'I don't want to hear from PAE again.'
About designing from data you can't trust:
When the data source is hardware with known faults, the design has to account for unreliable states, not just happy paths. Last sync timestamps, empty states, and data freshness indicators aren't edge cases; they're the experience most users will encounter first.
About demo vs. daily use design:
A product that impresses in a 30-minute demo and frustrates in daily operation has solved the wrong problem. The coordinator running 300 deliveries before 9am has different needs than the governor reviewing a dashboard in a sales meeting. Conflating those audiences produces design that serves neither.
About advocacy without authority:
Pushing for user-centered improvements when the institutional frame is 'this is already done' requires translating design decisions into business risk, not just user experience arguments. What I'd do differently: frame incomplete JTBD work as compliance risk and churn risk, not as a design preference.
For next time:
Separate demo design from daily-use design explicitly at project start — different audiences, different success criteria, different design decisions. Don't let one collapse into the other.
Frame user-centered work in terms the business cares about: if coordinators can't report incidents efficiently, compliance data is incomplete; if reports are hard to find, administrators stop using the system. Translate JTBD into institutional risk.
Document what's unfinished and why before leaving a project — not as a personal record, but as a handoff artifact. The next designer shouldn't have to rediscover the same constraints.


